October 2024

DOGE Analysis: Fibonacci Levels and Key Resistance Zones

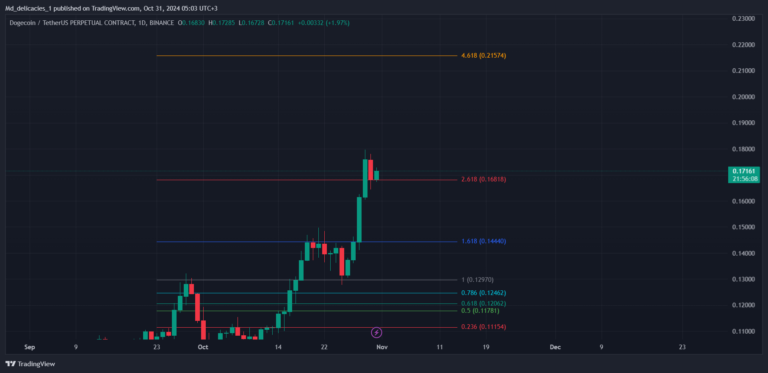
Fibonacci Level and Retracement: DOGE reached the 1.618 Fibonacci level at the price zone of $0.14440 before retracing to $0.12970. This retracement occurred at a significant zone that acted as a breaker block on the daily timeframe. Breakthrough of Key Resistance Levels: DOGE has successfully broken through two key resistance zones: the initial resistance at […]

DOGE Analysis: Fibonacci Levels and Key Resistance Zones Read More »

BNB Analysis: Retracement and Key Resistance Levels

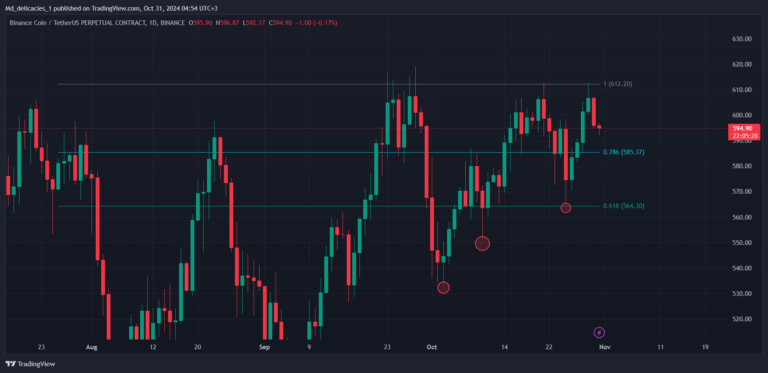
Current Retracement and Higher Low Formation: BNB retraced back to $564, establishing a new higher low above the previous low of $551. This formation indicates sustained bullish momentum for BNB. Resistance Level: Currently, BNB is facing resistance at $612. Breaking through this zone is crucial for further upward movement. Future Target: Once the $612 resistance

BNB Analysis: Retracement and Key Resistance Levels Read More »

SOL Analysis: Uptrend Continuation and Key Targets

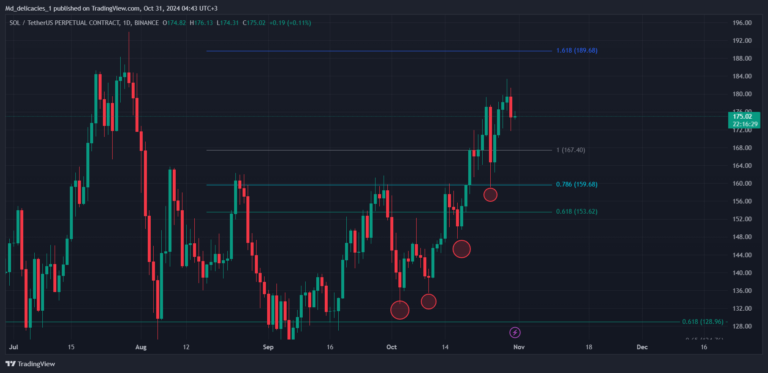
Current Uptrend with Higher Lows and Highs: SOL is maintaining an uptrend characterized by consistent higher lows and higher highs, suggesting continued bullish momentum. Key Retracement Zone: Recently, SOL retraced back to the 0.786 Fibonacci level at $159, where support held, setting up for a potential continuation. Future Targets: The next target for SOL is

SOL Analysis: Uptrend Continuation and Key Targets Read More »

ETH Analysis: Key Retracements and Fibonacci Levels

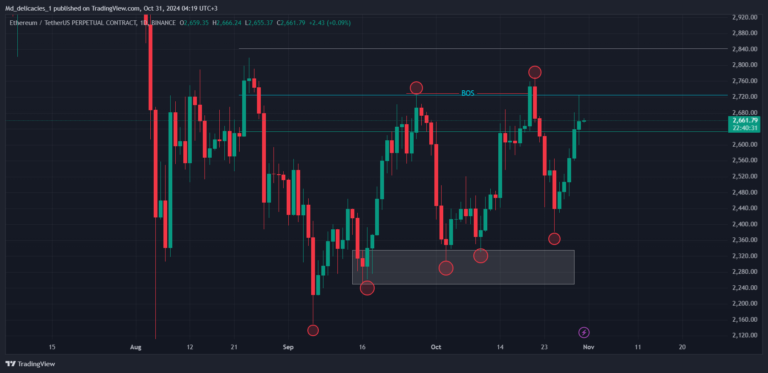
Healthy Retracement and Structure Formation: ETH experienced a healthy retracement back to $2,380 after breaking structure at $2,700, establishing a new higher low above the previous low of $2,337. This higher low indicates continued upward momentum, setting the stage for further gains. Key Resistance Levels and Targets: ETH has successfully surpassed the $2,633 resistance zone

ETH Analysis: Key Retracements and Fibonacci Levels Read More »

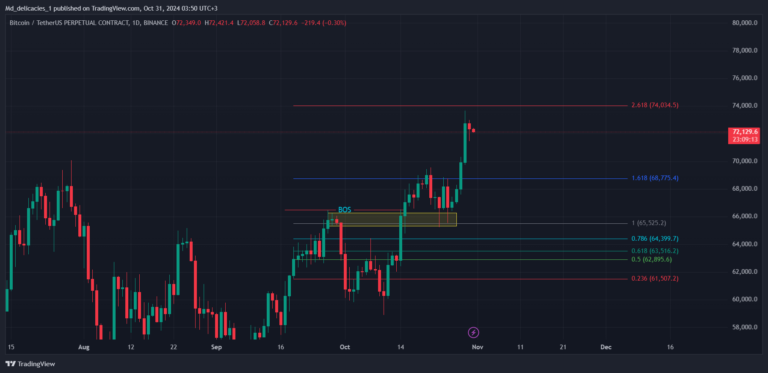
BTC Analysis: Flag Pattern and Key Fibonacci Targets on Weekly and Daily Timeframes

Weekly Timeframe – Flag Pattern Breakout and Retest: BTC formed a flag pattern on the weekly timeframe, with a recent candle closure above the trendline, indicating a potential continuation of the uptrend. After breaking above the trendline, BTC retested it, closing above with only a wick to the downside—signaling strong support. Daily Timeframe – Multiple

BTC Analysis: Flag Pattern and Key Fibonacci Targets on Weekly and Daily Timeframes Read More »

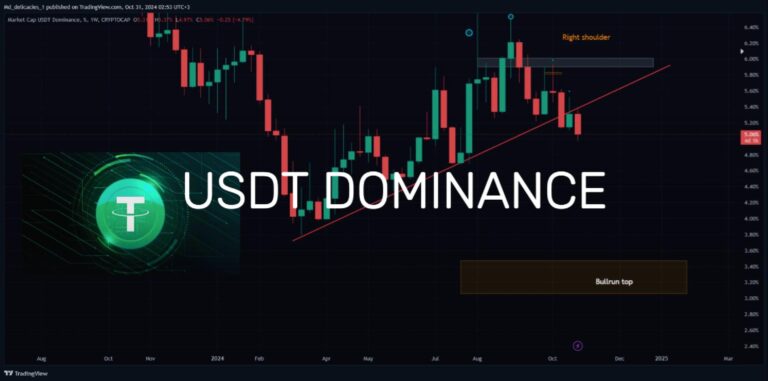
USDT Dominance Analysis on the Weekly and Daily Timeframes

USDT Dominance Breakdown Weekly Trend Break and Retest Confirmation: USDT dominance broke its previous uptrend on the weekly chart, showing a significant change in momentum. After breaking below the trendline, it retested this line but only left a wick above, indicating strong downward pressure. This retest concluded with a weekly candle closure below the trendline,

USDT Dominance Analysis on the Weekly and Daily Timeframes Read More »

Scroll to Top