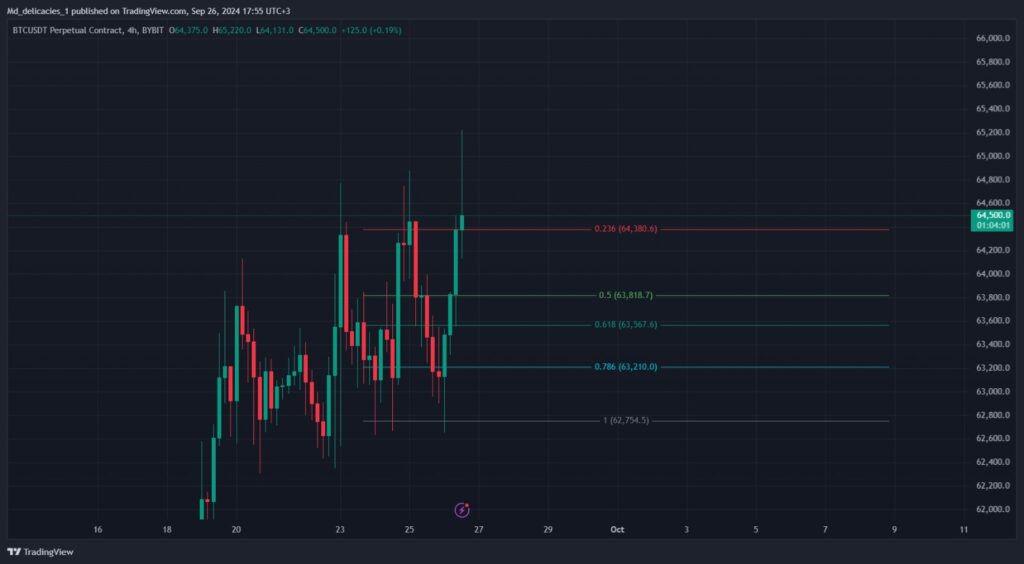
The cryptocurrency market is buzzing as Bitcoin (BTC) has recently hit a new peak of $65,200. This significant price surge has ignited optimism among traders and investors, many of whom are closely monitoring whether Bitcoin can maintain its momentum and close above this critical level. However, with support levels and potential corrections in sight, there’s an equal measure of caution among market participants.
In this blog post, we’ll delve into the current price movement of Bitcoin, the technical analysis behind key support and resistance zones, and what traders should keep an eye on in the coming days.
Breaking Down the Key Price Zones for Bitcoin
As of the latest data, Bitcoin has surged to $65,200, a notable milestone in its recent price action. Here’s a closer look at the significant levels:
- Resistance at $65,000: This level is a critical psychological and technical resistance point. A break above $65,000 with strong volume could lead to further bullish action. Traders are keenly watching the daily close to see if BTC can solidify its position above this threshold. If it does, we could see further upward momentum toward the next key resistance levels.
- Support Around $62,700: Bitcoin has established a robust support zone around $62,700. This level has proven to be a reliable cushion, with buyers stepping in to push prices higher when BTC approaches this zone. If Bitcoin were to retrace in the short term, $62,700 could serve as the first line of defense.
- Next Targets if Support Is Lost: If BTC loses its current support levels, the next significant targets to monitor are $61,000 and $59,000. A drop below $61,000 would indicate a more significant bearish correction, and the $59,000 level would likely be the next major floor where buyers could regain control.
Fibonacci Retracement Analysis
Using Fibonacci retracement levels, we can better understand the potential correction zones for Bitcoin. Key levels to watch include:
- 0.236 Level at $64,380: Bitcoin is trading just above this level. If the price fails to hold above this point, we could see a correction down to lower Fibonacci levels.
- 0.5 Level at $63,818: This is another critical retracement level, representing a possible target if the price dips. It also aligns closely with previous support zones.
- 0.618 Level at $63,567: A further retracement could see Bitcoin testing this level. It’s a popular zone for traders to look for price reversals.
- 0.786 Level at $63,210: Should Bitcoin continue to retrace, this deeper level could serve as another point where buyers step in to prevent a larger sell-off.
Potential Scenarios: What to Expect Next
- Bullish Breakout: If Bitcoin can close the daily candle above $65,000 with strong buying pressure, we could see a further rally. The next immediate resistance to watch would be $66,000, followed by $68,000. A successful breach of these levels could see Bitcoin testing new all-time highs in the coming weeks.
- Failure to Break $65K: On the flip side, if Bitcoin fails to break $65,000 and experiences a rejection, we might see a short-term pullback to retest lower support zones around $63,000 and $61,000. Traders should be prepared for increased volatility, especially as the market reacts to these key levels.
- Extended Bearish Correction: In the event of a significant correction, Bitcoin could dip to the $59,000 level. A loss of the $61,000 support would likely indicate a deeper bearish trend, bringing this level into focus as a major buy zone for long-term holders.
Market Sentiment: Optimism with Caution
Overall, the sentiment in the market remains cautiously optimistic. On one hand, the price surge to $65,200 has renewed confidence that Bitcoin could continue its rally. On the other hand, the possibility of a short-term correction remains a factor, with key support and resistance zones guiding market participants’ decisions.
What’s Driving the Price Movement?
Several factors could be contributing to Bitcoin’s recent rally:
- Institutional Interest: Increased interest from institutional players, such as large financial firms and investment funds, continues to be a driving force behind Bitcoin’s long-term price trajectory.
- Federal Reserve’s Potential Rate Cuts: Speculation that the U.S. Federal Reserve might cut interest rates by 50 basis points has been fueling investor optimism. A looser monetary policy could push more capital into riskier assets like Bitcoin.
- Supply and Demand Dynamics: With a capped supply of 21 million BTC and a growing number of investors looking to hedge against inflation, the basic principle of supply and demand continues to favor long-term bullish sentiment for Bitcoin.
Conclusion: A Pivotal Moment for Bitcoin
Bitcoin is at a critical juncture, with $65,000 acting as a make-or-break level. Whether BTC can sustain its upward momentum or if a pullback is on the horizon remains to be seen. Traders should closely watch key support and resistance levels, as well as broader market conditions, to make informed decisions.
Disclaimer: This article is for informational purposes only and does not constitute financial advice. Always do your own research before making any investment decisions.
ENG WANJIKU
Views: 8


