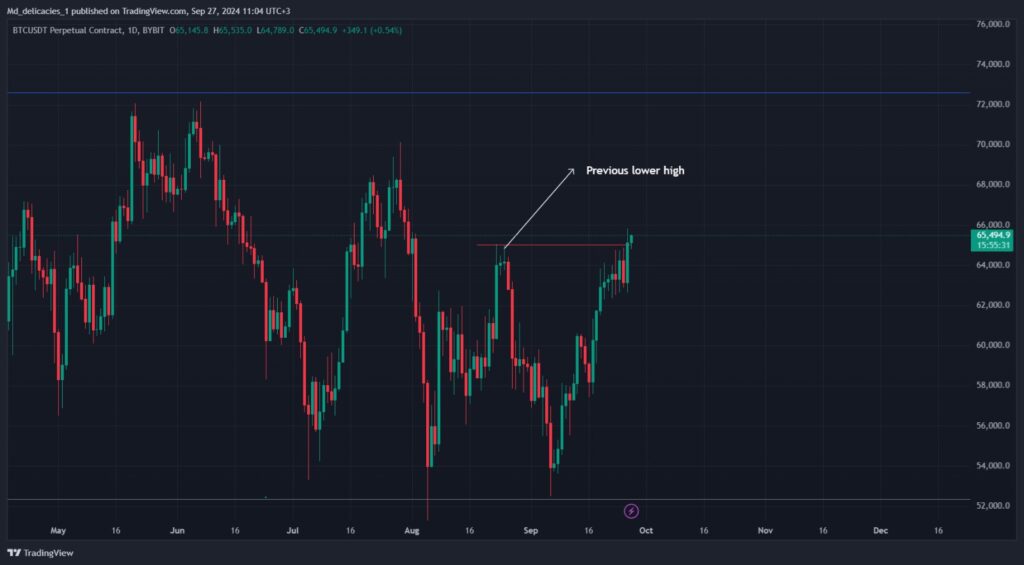
As September draws to a close, Bitcoin (BTC) is sending ripples through the crypto market by breaking above critical resistance levels, confirming an upward trend. After setting a daily candle close above the $65,000 mark, many crypto enthusiasts and traders alike are eyeing key levels and anticipating whether BTC will continue its march higher. Here’s a detailed breakdown of what this means for the market, and what traders should expect moving forward.
Market Overview

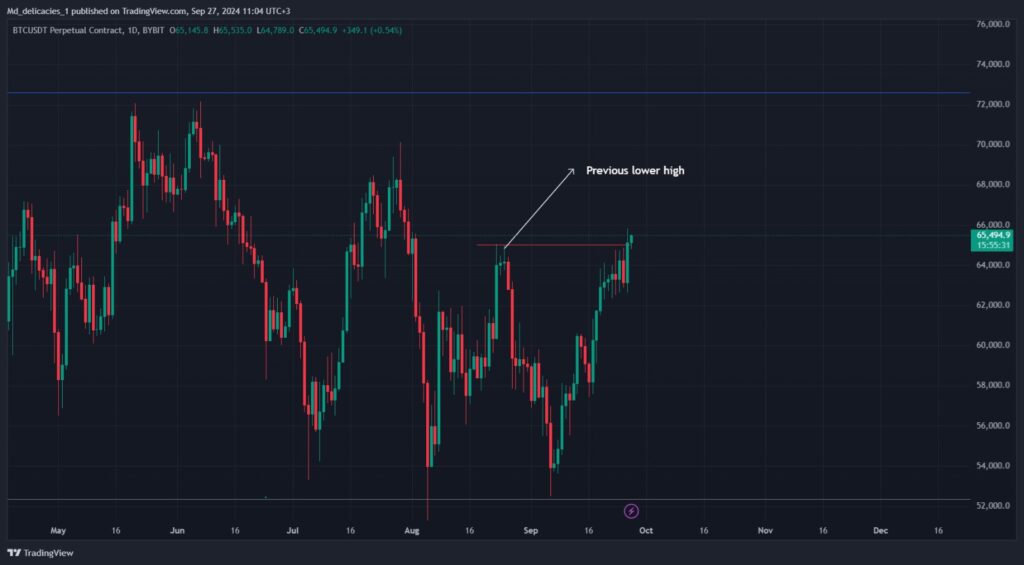
The chart provided shows Bitcoin breaking out of its previous “lower high” pattern, closing the daily candle above $65K. This significant move has many market participants talking about the potential continuation of the bullish trend. With BTC now well-positioned above this critical level, the next key areas to watch are the $71,000 and $74,000 resistance zones.
Key Technical Analysis: Higher Highs and Next Resistance
Higher High Formation
The upward momentum has shifted the market structure to form a new higher high, effectively ending the lower-high pattern observed in previous months. This indicates a potential long-term shift in trend, often considered one of the key signals in technical analysis that the bulls are taking control.
Key Resistance Levels to Watch
- $71,000: The next major hurdle that BTC will likely face is around the $71K level. This level has acted as resistance in the past and will be the first major test of the bulls’ strength.
- $74,000: Should BTC push through $71K, the next level of significance would be around $74,000. Breaking past this level could send BTC into price discovery mode, with new all-time highs within sight.
Potential Retracement: Fib Levels at $61K and $59K
While Bitcoin is showing strength, markets never move in a straight line. A potential retracement to retest lower support levels could still be on the horizon. Based on Fibonacci retracement levels, the zones of $61,000 and $59,000 are areas to watch for a potential pullback.
What is Fibonacci Retracement?
Fibonacci retracement is a popular technical analysis tool used by traders to identify potential reversal levels. The key levels to watch in this context are typically 38.2%, 50%, and 61.8%. In this case, if Bitcoin does pull back, these levels could act as new support before the next leg up.
However, given the current strength of the market, many traders are hesitant to bet on a short-term correction. Shorting such a strong move could be risky, and many traders are focusing on buying the dips rather than taking bearish positions.
Is it Time to Buy or Wait?
For traders in Kenya and worldwide, the question remains: Is now the time to jump in, or should we wait for a retracement? Here’s a balanced take:
- For Short-Term Traders: Caution is advised, especially with BTC potentially approaching major resistance at $71K. However, momentum traders might find opportunities for profit if BTC continues its rally without a major pullback.
- For Long-Term Investors: If you believe in Bitcoin’s long-term growth and its potential as a hedge against inflation, the current breakout may be a good entry point. Even if a retracement occurs to $61K or $59K, those levels would present solid buying opportunities.
Market Sentiment: Heading into October
Historically, October has been a strong month for Bitcoin and cryptocurrencies as a whole. Known as “Uptober” in crypto circles, the month is often associated with renewed optimism and bullish price action. If Bitcoin continues its upward momentum, we could see the price head into uncharted territory before the end of the year.
Many traders and analysts are preparing to welcome October with open arms and portfolios poised for profits. If Bitcoin manages to break through the $71K and $74K resistance levels, it could kick off a new bull run that may rival its 2021 highs.
Conclusion: Cautious Optimism for Bitcoin’s Future
Bitcoin’s recent surge above $65,000 has reignited bullish sentiment in the market. While there may be potential retracements to the $61,000 or $59,000 levels, the broader outlook remains positive. With key resistance levels ahead at $71,000 and $74,000, traders should stay vigilant and be ready for both potential pullbacks and further bullish movement.
Whether you’re a short-term trader looking for opportunities or a long-term investor, Bitcoin’s price action is a reminder that volatility is always present—but so are the potential rewards.
ENG WANJIKU
Views: 6


