Weekly Timeframe – Flag Pattern Breakout and Retest:
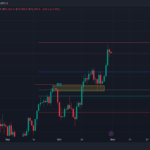
- BTC formed a flag pattern on the weekly timeframe, with a recent candle closure above the trendline, indicating a potential continuation of the uptrend.
- After breaking above the trendline, BTC retested it, closing above with only a wick to the downside—signaling strong support.

Daily Timeframe – Multiple Retests and Structure Break at $70,000:
- On the daily chart, BTC has repeatedly retested the trendline, maintaining strength as daily candles continue to close above it.
- A critical break of structure was observed at $70,000, which marked the last lower high before BTC retraced to $49,000 back in August 2024. This break is a key zone in BTC’s price action.

Fibonacci and Breaker Block Analysis:
- The break of structure first occurred at $66,400.
- BTC’s next target was at the 1.618 Fibonacci level ($68,700).
- Following the rise to $68,700, BTC retraced again to the $66,400 breaker block before pushing upward to reach $70,000 and, ultimately, $73,000.

Future Targets in the Uptrend:
- In this ongoing uptrend, the next key target for BTC is $74,034, aligning with the 2.618 Fibonacci level, likely serving as a new point of resistance.
- Another critical target to watch is $84,500, which lies at the 4.618 Fibonacci level, marking it as a significant resistance zone for BTC’s continued upward momentum.

For more updates on this story and other crypto insights, follow us on social media:
- Twitter: @_KenyaCryptoMag
- Instagram: @KenyaCryptoMag
- WhatsApp: Join our WhatsApp
MD_DELICACIES
Views: 4


