Bitcoin’s Critical Support: Will $60K Hold, or Are We Headed for $58K and Below?
The big question now is whether BTC will hold the current $60k support zone or drop lower, potentially to $58k. Let’s break down the current technical setup and liquidity points to get a clearer picture.
Rate Cuts and Higher Highs:
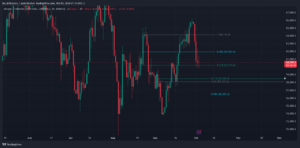
Since the first rate cuts, BTC rallied to the 66k zone, forming a higher high on the daily time frame. This is a bullish sign, indicating a trend reversal from bearish to bullish, especially as BTC closed above the previous lower high at 65,100. However, after forming this higher high, BTC has been retracing, leading us to the current support zones.
Key Observations:
- 60k Support Zone:
BTC is holding the $60k support level for now. This is crucial as no daily candle has closed below $60,400, making this a key support zone. However, if BTC breaks below this level, we could be looking at further downside pressure. - CME Gap at 60.8k:
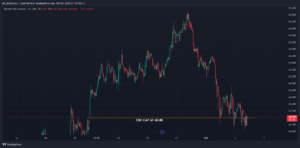
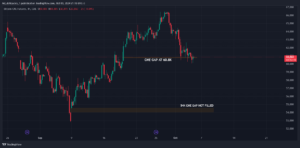
On the 1-hour time frame, we had a CME gap at 60.8k, which has been filled already.
- 58k-58.4k Support Zone:
If the 60k zone breaks, BTC could drop to the 58k-58.4k range. This area is significant as it completes an inverted head and shoulders pattern, (this is on a daily time frame) a bullish formation that could lead to a price reversal. This zone might see some flash wicks down to the 56,400 level, but it remains an important zone to watch.
- CME Gap at 54k:
There’s a 4-hour CME gap at 54k that hasn’t been filled yet. If BTC drops into the mid-50k region, this could be a target, sweeping liquidity in the 58k, 56k, and 54k zones before a potential recovery.
USDT Dominance and Market Sentiment:
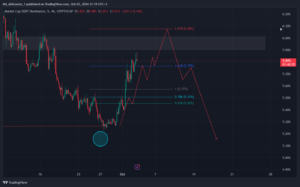
- USDT Dominance: USDT.D broke below a key support level of 5.26%, forming a lower low. This signals a potential change from a bearish wave in BTC to a more bullish one. USDT.D has completed its 3rd Elliott wave to the 1.618 Fibonacci level and retraced to form the 4th wave at 5.64%. Now, we’re seeing the 5th wave, which typically hits the 2.618 Fibonacci level, between 5.9% and 6.10%.

- What Happens Next:
- If USDT.D reaches 6.10%, it may start to decline, which could trigger a BTC rally. However, if BTC breaks below its current support, we may see BTC sweeping the liquidity levels at 58k, 56k, and even 54k.
Conclusion:
BTC’s price action will depend on whether it can hold the 60k support zone. If it breaks below, expect further declines towards 58k and possibly lower.
Keep an eye on USDT.D, as its movement will give us clues about when BTC might start its next bullish wave.
MD_DELICACIES
Views: 34


Pingback: Bitcoin Weekly Update: Navigating Support Levels Amid Market Volatility