Technical Analysis

Master the Art of Predicting Market Movements

Elevate your trading skills with Kenya Crypto Magazine’s Technical Analysis and Futures Trading segment. Dive into in-depth analysis techniques, learn to interpret market charts, and discover strategies for successful futures trading. Our expert resources provide you with the tools and insights needed to understand market trends, manage risk, and make informed trading decisions. Whether you’re a seasoned trader or new to the world of futures, our segment equips you with the knowledge and skills to navigate the complexities of crypto markets and maximize your trading potential

BTC Daily Timeframe Analysis: Retracement and Impact of Upcoming US Elections

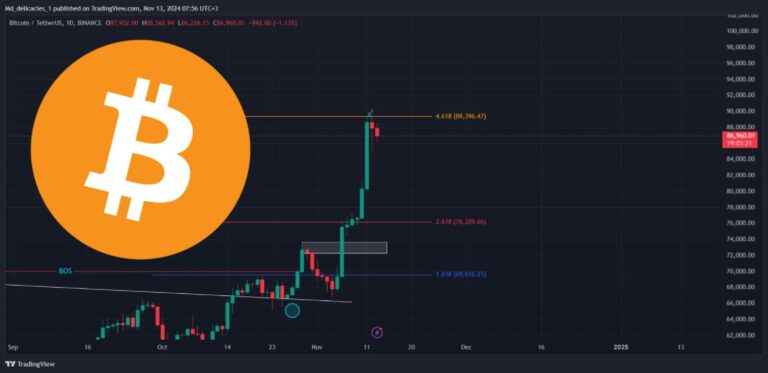
Recent High and Retracement: BTC recently reached $73,000 on the daily timeframe before beginning a retracement. This pullback is positive, as it allows for liquidity on the downside to be collected, stabilizing the uptrend. Timing of Retracement Before US Elections: The timing of BTC’s retracement ahead of the US elections is also beneficial. If BTC […]

BTC Daily Timeframe Analysis: Retracement and Impact of Upcoming US Elections Read More »

DOGE Analysis: Fibonacci Levels and Key Resistance Zones

Fibonacci Level and Retracement: DOGE reached the 1.618 Fibonacci level at the price zone of $0.14440 before retracing to $0.12970. This retracement occurred at a significant zone that acted as a breaker block on the daily timeframe. Breakthrough of Key Resistance Levels: DOGE has successfully broken through two key resistance zones: the initial resistance at

DOGE Analysis: Fibonacci Levels and Key Resistance Zones Read More »

BNB Analysis: Retracement and Key Resistance Levels

Current Retracement and Higher Low Formation: BNB retraced back to $564, establishing a new higher low above the previous low of $551. This formation indicates sustained bullish momentum for BNB. Resistance Level: Currently, BNB is facing resistance at $612. Breaking through this zone is crucial for further upward movement. Future Target: Once the $612 resistance

BNB Analysis: Retracement and Key Resistance Levels Read More »

SOL Analysis: Uptrend Continuation and Key Targets

Current Uptrend with Higher Lows and Highs: SOL is maintaining an uptrend characterized by consistent higher lows and higher highs, suggesting continued bullish momentum. Key Retracement Zone: Recently, SOL retraced back to the 0.786 Fibonacci level at $159, where support held, setting up for a potential continuation. Future Targets: The next target for SOL is

SOL Analysis: Uptrend Continuation and Key Targets Read More »

ETH Analysis: Key Retracements and Fibonacci Levels

Healthy Retracement and Structure Formation: ETH experienced a healthy retracement back to $2,380 after breaking structure at $2,700, establishing a new higher low above the previous low of $2,337. This higher low indicates continued upward momentum, setting the stage for further gains. Key Resistance Levels and Targets: ETH has successfully surpassed the $2,633 resistance zone

ETH Analysis: Key Retracements and Fibonacci Levels Read More »

BTC Analysis: Flag Pattern and Key Fibonacci Targets on Weekly and Daily Timeframes

Weekly Timeframe – Flag Pattern Breakout and Retest: BTC formed a flag pattern on the weekly timeframe, with a recent candle closure above the trendline, indicating a potential continuation of the uptrend. After breaking above the trendline, BTC retested it, closing above with only a wick to the downside—signaling strong support. Daily Timeframe – Multiple

BTC Analysis: Flag Pattern and Key Fibonacci Targets on Weekly and Daily Timeframes Read More »

Scroll to Top