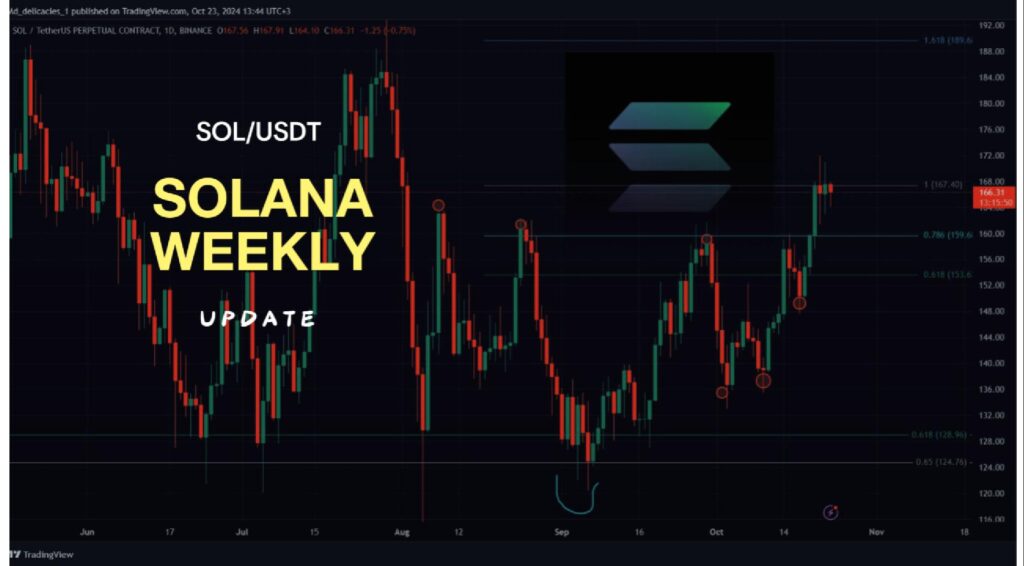
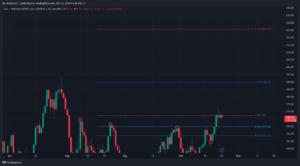
On the weekly chart, Solana broke through the $159 resistance zone and reached the $167 price zone, where it is currently facing resistance. The $159 level was significant, having experienced multiple instances of resistance on a weekly basis.
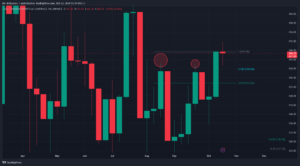
The daily chart provides a clear view of the current situation. We can observe a break of structure at $161, along with two consecutive higher lows at $135 and $147, indicating the bullish momentum of Solana. Additionally, there have been three daily candle closures below $167, highlighting the strength of this current resistance zone
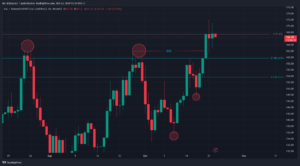
On the daily timeframe line chart, we can observe three breaks of structure: the first at $158, the second at $160, and the most recent at $163. This pattern indicates the bullish momentum Solana has experienced after breaking the resistance zone at $159
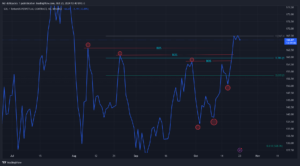
Once Solana breaks through this resistance zone, the next key targets will be $168 and $225.
For real-time updates and in-depth analysis, follow Kenya Crypto Magazine:
MD_DELICACIES
Views: 22

