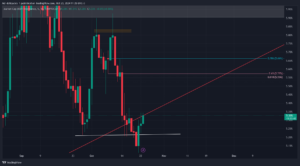
USDT dominance on the weekly chart has broken the upward momentum it had been following, creating a new low below the previous one at 5.23%. This signals a potential shift in direction from an uptrend to a downtrend.

The daily chart offers a clearer picture of USDT dominance. Initially, the head and shoulder pattern suggested that the right shoulder would find support at the 6.21% level. However, strong resistance emerged at 5.90%, marking the formation of the right shoulder. After breaking the 5.23% low, it’s evident that the trend has shifted from an upward trend to a downward trend. This break confirms a reversal, indicating further potential downside movement for USDT dominance.

This is the macro outlook of USDT dominance on the daily timeframe. It provides a broader perspective of the market’s movement, especially after the break of key support levels like 5.23%, which signals a shift from an upward trend to a potential downtrend

After breaking the 5.23% level, USDT dominance is now testing the upward trend line (red line). If it manages to break this resistance, the ideal levels for a retest would be around 5.55% and 5.66%. However, for a clear confirmation, we would need to see a daily candle closure below the 5.66% level. Once this happens, USDT dominance is expected to start a new leg downward, signaling a potential pump in altcoins. The next key target for USDT dominance on the downside will be at 4.68%.


For real-time updates and in-depth analysis, follow Kenya Crypto Magazine:
MD_DELICACIES
Views: 22


